Ecoblog
The carbon footprint of an event

In an earlier blog, I calculated that IHME’s “low-emission art production” could have a carbon footprint of the order of 2,000 kg CO2e.
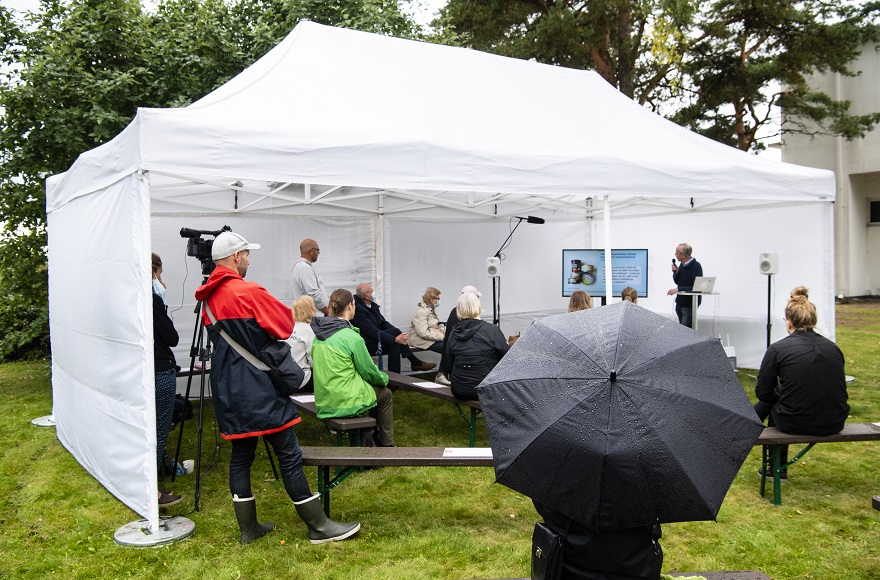
Due to the corona pandemic, the sound installation Listening through the Dead Zones commissioned by IHME Helsinki for the Rowing Stadium in 2020 will be postponed until August 2021. One part of the artwork, a seminar about the Baltic Sea, was held on August 22, 2020. It was originally designed as the closing event of the sound installation, but now it has become the launch event for the artwork.
How does the preliminary estimate match reality?
Without the sound-installation, the carbon footprint of this low-emission art production will be only 35 kg CO2e instead of 2,000 kg. The interesting question is, how does the 35 kg estimate correlate with reality?
Our carbon-footprint calculator covers five categories: energy, travel, waste, procurement, and services and events, which includes food. Below you can see the results for each group.
Short outdoor event in the summer – very little energy needed
Energy was only used to run electrical devices (55-inch monitor, audio, camcorder, internet connections). As IHME was not a long-term tenant of the Rowing Stadium, despite inquiries, we did not enter into an electricity contract with the energy company. We had to settle for the conventional electricity used by the City of Helsinki. However, electricity consumption of the few hours of was low: 2 kWh, or 0.5 kg CO2. There was no heating at the event, so heating emissions were 0 kg CO2.
More travel emissions than expected
Travel emissions were 99 kg CO2e. Most of the emissions were caused by the delivery of the rental tents and the travel emissions of one of the organizers, who arrived from outside the Helsinki metropolitan area. A few taxi rides within Helsinki from the city centre to the Rowing Stadium accounted for just one percent of travel emissions. Jana Winderen saved us 500 kg of CO2 by participating in the event through a remote connection!
The Seminar – from writing to video
The Seminar presentations are available as online videos totalling 2 hours. Assuming that the videos are watched 2,200 times using conventional Finnish electricity, emissions for broadcasting the seminar will be 28 kg CO2e, considerably more than publishing the presentations in written form on a website, as originally planned.
We calculated the emissions based on an information that a 2-hour streaming using a laptop would consume 0.09 kWh (based on the following power usage: laptop 30 W, CPE 5 W, network and data center 10 W) and multiplied this number by the average emissions of Finnish electricity production, 141 g CO2e/kWh. These assumptions will produce total emissions of 12.9 g per 2-hour streaming. It’s worth noticing that this number does not include emissions from the production of the ICT devices.
According to another source, the emissions per one-hour streaming would be 42,3 g CO2e, which would produce total emissions of 84,6 g CO2e per 2-hour streaming. This is presumably calculated for a desktop computer, which consumes 0,1 kWh per hour, causing 14.1 g CO2e emissions per hour. If those emissions are replaced with the emissions from a laptop (0.007 kWh per hour), the emissions for the end device will be only 1 g CO2e per hour. That would mean 28.2 g CO2e emissions per one hour streaming on laptop and 56.4 g CO2e emissions per 2-hour streaming on a laptop. The emissions of 28 kg CO2 would allow 500 views.
Food causes a lot of emissions, just as anticipated
Because of the corona virus, there was a dilemma with food: from the hygiene perspective, everything should have been packaged individually, from the ecological perspective, nothing should have been packaged individually. As a corona measure, coffee was not served at the event. A small lunch was provided only to participants in beach cleaning, staff and speakers. Individually packaged falafel pita breads were selected as the meal. Coffee, tea and mineral water were reserved for speakers. The carbon footprint of the food was calculated to be 27 kg CO2e.
Low emissions from waste
Waste was mainly generated in four situations: eating, changing corona masks, washing/drying hands and unpacking advertising posters. Little waste was generated, less than 2 kg, and total emissions from waste were less than 1 kg CO2e. The emissions from the waste management of the garbage collected in the beach-cleaning action were also about 1 kg CO2e. However, they were not included in the total emissions as they are not the responsibility of the cleaner, but of those who (intentionally or not) left them in nature.
Our calculator’s Services and Events category also included: Network traffic and postal services emissions of 11 kg CO2e, and the same for the T-shirts produced by Jana Winderen, which combine climate change and oxygen deprivation in the Baltic Sea in an imaginative way.
Procurement – more information needed!
Procurement is the most difficult and relatively incomplete category in the counter. The calculator contains a list of different products for which an emission factor has been calculated using lifecycle analysis. The figure is quite reliable because it is based on research. The only problem is that the list is short and the products listed are few.
Concrete example: We acquired a modem for the event. The calculator has a carbon footprint for a printer, computer, monitor, and mobile phone, but not for a modem. Could I use a printer’s emission factor for the modem? Or, since the printer is big, but the modem is small, could I assume that the modem’s emissions are half that of the printer? Several other items are missing from the list: hand disinfectant, corona masks, toilet paper, outdoor tent rental, and audio and video recording.
What to do about missing information?
There are at least two solutions to the problem: The first is to omit that detail from the calculation and comment on it in the written part of the calculation. Another option is to make a rough estimate.
For a rough estimate, the ratio of money spent to emissions generated can be used. In Finland, about 0.5 kg of greenhouse gas emissions are generated per euro used. In addition, different groups of consumer goods have their own emission factors (kg CO2e/€). For example, liquid soaps, toilet paper and garbage bags are in a product group that produces fewer emissions; a factor of 0.3 can be used for these purchases. For disinfectants and masks the factor is 0.2 and for modems 0.1. The combined emissions of all these purchases are 46 kg CO2e. Since items are also used after the event, it is reasonable to divide this figure by a factor of two – between the launch event and subsequent use. We ended up with the emissions of 23 kg CO2e.
On the other hand, I did not find a group for the rental of tents and other equipment. Their total cost was about 1,000 euros. Would households have been charged the same amount for the service as our organization? According to the average emission factor of 0.5, emissions would be around 500 kg CO2e, but this sounds unreasonably high. What should the figure be? In this situation, I played the “call an expert” card. I found out that the emissions of product groups similar to rented equipment are about 0.2 kg CO2e/euro. Using this figure, the emissions would be 90 kg for tents and 120 kg for other equipment, a total of 210 kg CO2e. However, without data about the production emissions on one hand, or about the quantity of rentals on the other, it is impossible to assess the accuracy of this figure. Therefore, it was excluded from the total carbon footprint of the event.
Result of the calculation and lessons learned
Based on all these calculations, I concluded that the emissions from the event were not 35 kg CO2e, but 201 kg CO2e without tent and equipment rental. This indicates that the biggest source of emissions was travel, with food coming second – even if it wasn’t provided for everyone.
On basis of this calculation, two pieces of advice can be given for future events:
- Weigh up the various attendance options, especially for international guests. Using remote connections can significantly reduce emissions from an event. New technologies are evolving that also allow informal encounters.
- Pay attention to food. If possible, arrange the event at a venue where they make vegetarian food on the premises. This will reduce food waste and the need for disposable packaging. However, the largest emissions already occur in the production of food.
Carbon accounting is necessary and must be developed further
The carbon footprint calculation for the IHME launch event exemplifies today’s operating environment: decisions must be made on the basis of “good enough” information, tolerating uncertainties. The value of quantitative indicators must be recognized, but also their limits. Carbon-footprint accounting only provides information about the variables included in the calculator, only products and services whose carbon footprint has been calculated in accordance with generally accepted methods. The more time and money we invest in them, the more accurate calculators and tools become and the more our understanding of carbon emissions increases.
Monitoring your carbon footprint can be compared to budgeting: Up to a certain point, you can do without a budget, just by saving money. However, if you want not only to save, but also to spend money, it makes sense to have a budget. With a carbon budget you know where your carbon comes from and where the effort has to be placed. In the best-case scenario, calculating the carbon footprint allows operations to be continued with lower emissions and without affecting their core – in the case of IHME Helsinki, the art.
***
Original assumptions
The 35 kg calculation was based on the following assumptions:
- No heating needed
- Green electricity to be used at the venue
- Guests served a vegetarian meal
- Seminar presentations to be in text form on IHME’s website
- The calculation did not include public travel or advertising emissions.
The reality
In practice, the event, which was attended by about 35 people (including 10 persons of staff and speakers), included the following sections:
- No heating needed
- Conventional electricity was used at the venue (outdoor tent)
- Participants in beach cleaning and speakers were served a vegan meal
- The seminar was filmed on video and published on IHME’s YouTube channel
- Rented equipment was used (tent, tables, benches, video and audio gear)
- Waste was generated at the event
- Purchases were made for the event
The calculation did not include public travel (emissions 12 kg CO2) or emissions from advertising.
This article is part of a series published in 2020 about the carbon footprint of an art production, written by IHME eco-coordinator Saara Korpela.
Read all Ecoblog posts published in 2020:
- What do calories and carbon dioxide have in common?
- Time to start carbon footprint calculation!
- How to calculate the carbon footprint for heating?
- Small or large scale, emissions can be brought down
- Carbon footprint of art-production at IHME
- How to promote sustainable eating in an art organization?
- The carbon footprint of an event
- Miles and meetings
- Carbon footprints of art organizations and Carbon Challenge 2030


